DIONE Green Accountability component
Includes a compliance monitoring tool, which decides on beneficiaries’ compliance and is integrated with the existing tools of paying agencies and an AI-enabled environmental performance tool, accompanied with a visualization engine.
1. Compliance monitoring tool
A web-based tool being responsible for deciding on beneficiaries’ compliance with the CAP green direct payment scheme rules. The tool enables the collection of different data produced by the different DIONE tools and utilise them in the context of the CAP compliance monitoring process.
Some of its key functionalities include the visualisation of parcel boundaries, geotagged photos, biophysical indices (i.e. NDVI, CHL) and markers, layer management, displaying charts for selected location/parcel on the map regarding area monitoring markers, showing parcel information in tabular form, the ability (for Paying Agency inspector) to request geotagged photos through dedicated forms and the generation of reports on compliance monitoring.
The tool is accessible from here: https://compliance.dione.gilab.rs/
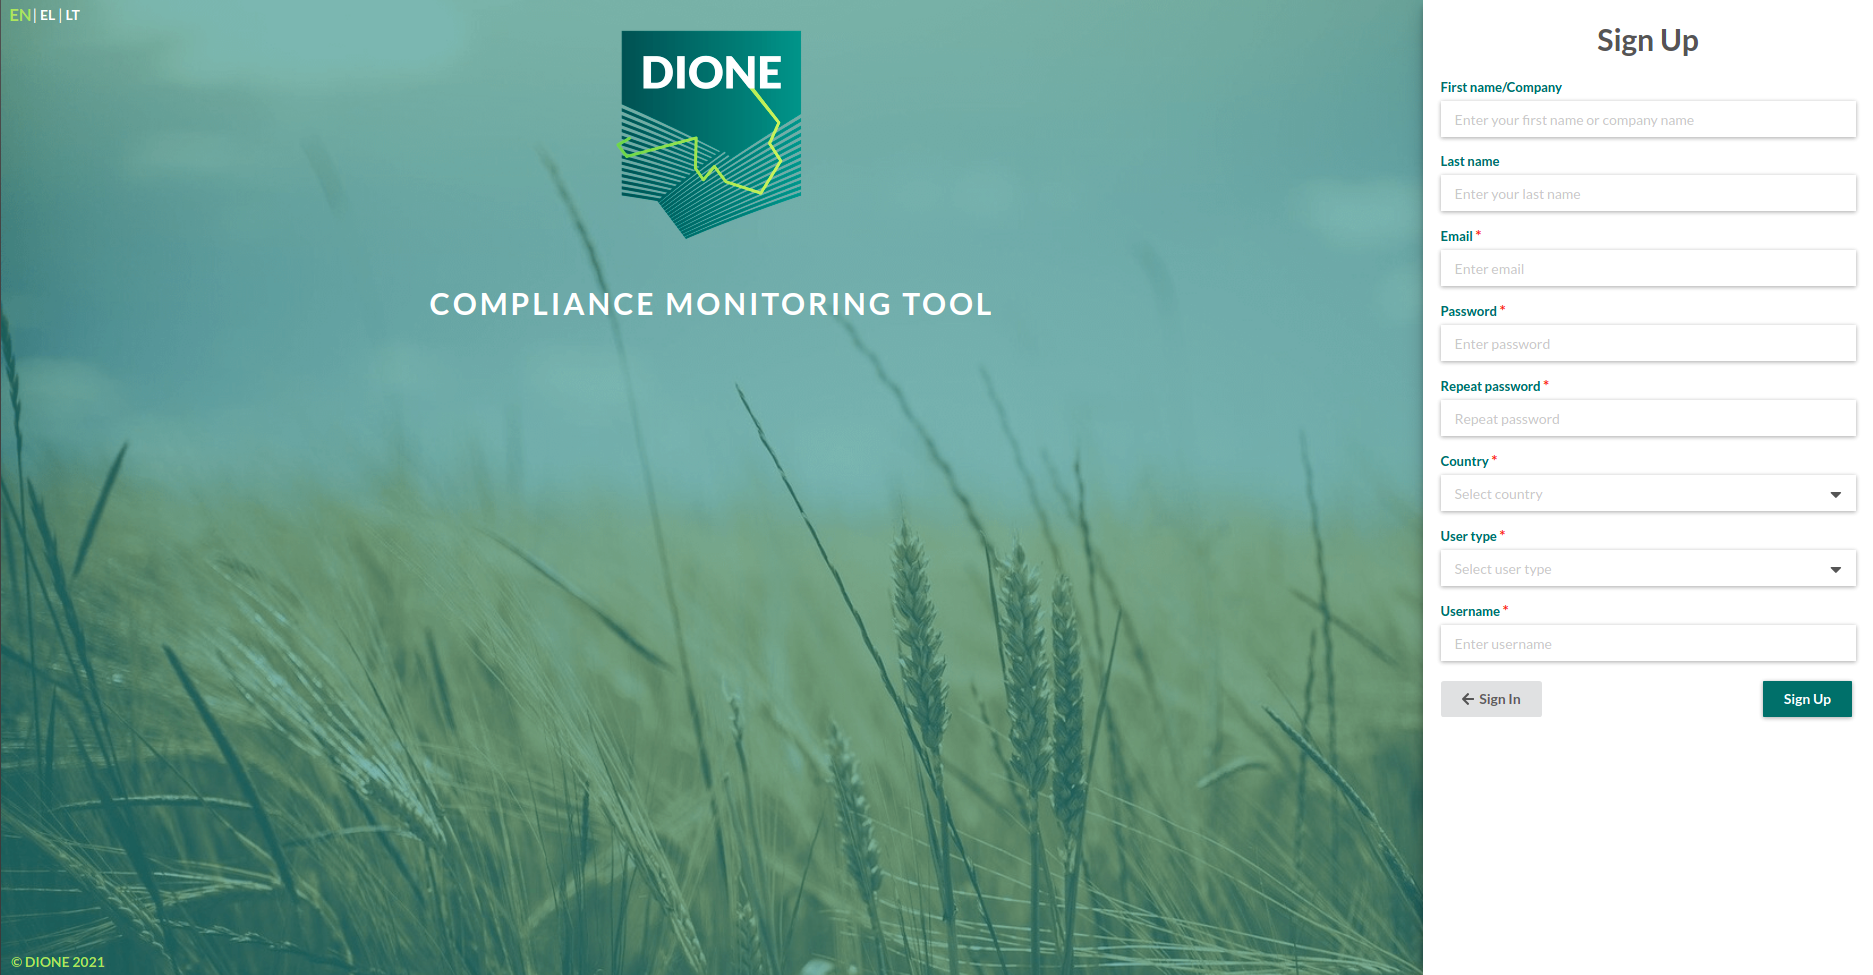
Compliance Monitoring Tool
Compliance Monitoring Tool
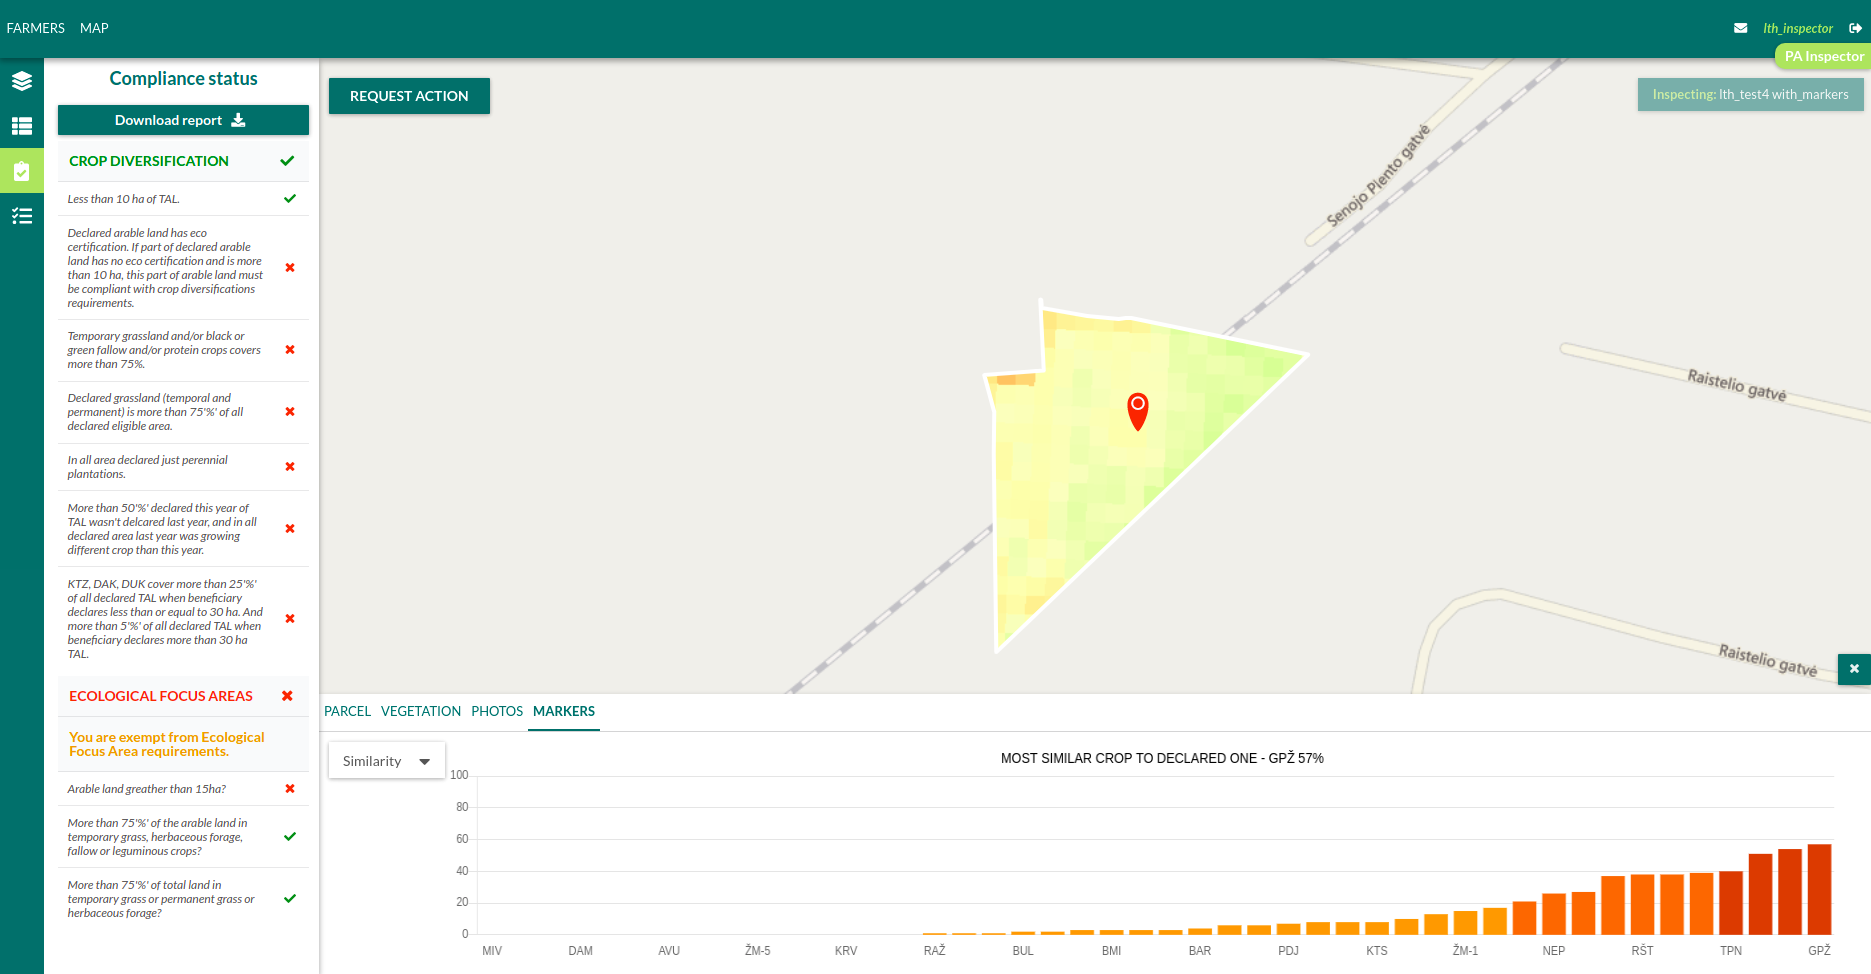
2. Environmental performance tool
You can access the tool here: https://projects-dione-
It represents an artificial intelligence tool for environmental performance estimation. More specifically the following indicators are computed via the tool:
- Land cover change which provides a qualitative and quantitative assessment of the change of land cover
- Organic farming which provides assessment of the area under organic agriculture
- Soil erosion which provides information about affected by a certain rate of soil erosion by water
- Soil organic matter which determines Soil Organic Carbon (SOC) concentration
- Greenhouse Gases emissions for monitoring concentration of Methane, Carbon Dioxide and Nitrous Oxide
- Water quality for monitoring Chlorophyll-α concentrations, Total Suspended Matter (TSM) and water temperature
- Land irrigation which provides mapping of irrigated and drainage areas
- Natura 2000 which provides information about areas characterized as Natura 2000
- High Nature Value (HNV) lands which provides information about areas characterized as HNV.
Additionally, an interactive visualisation dashboard has been developed where the environmental performance outputs are overlaid on maps along with proper metadata and style to convey the information.
Environmental Performance Visualisation
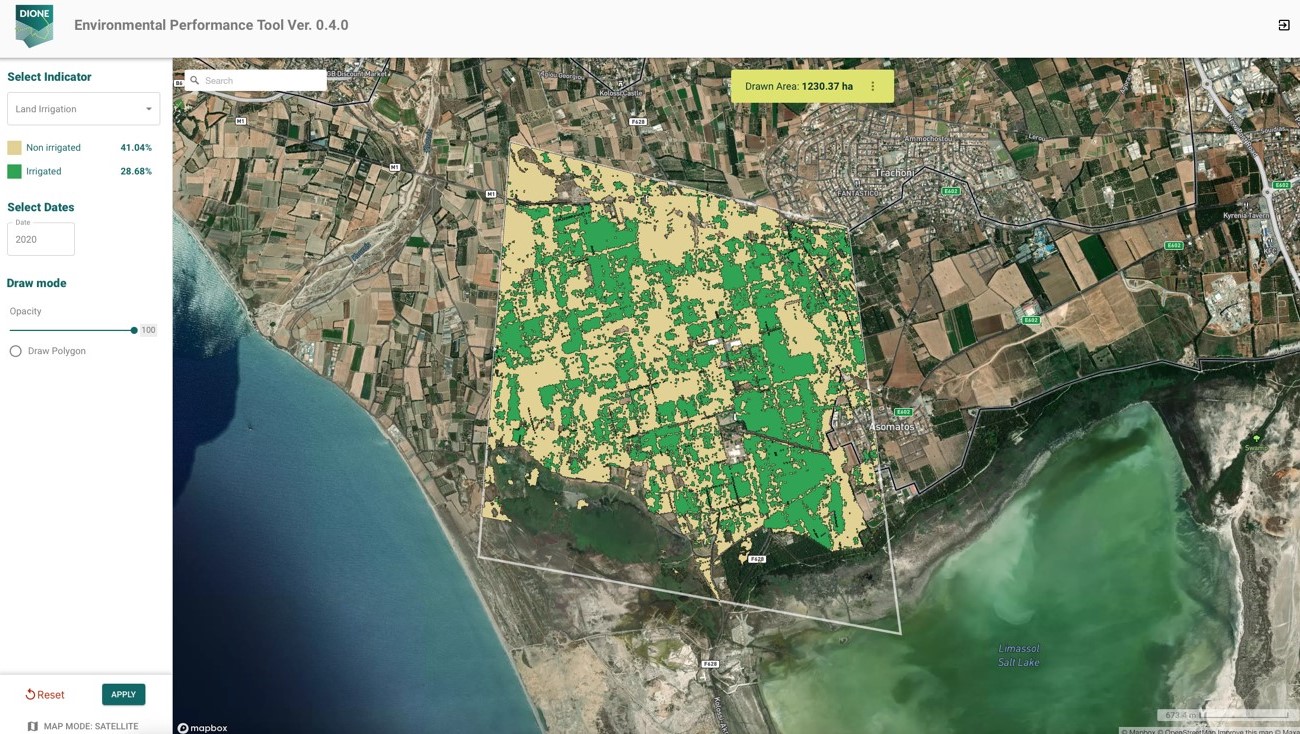
Environmental Performance Visualisation